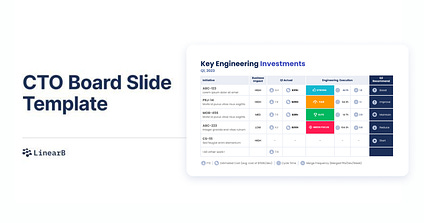
4 Engineering Slides CEOs Love (That You Can Have For Free)
If you want to skip this blog and use these slides for your team, you can find them here.
After years of speaking to thousands of CTOs, VPs of engineering, and executives who lead large teams of developers, I’ve learned that the most stressful thing in their lives isn’t a bug or a system crash.
What makes these leaders sweat, stress, and lose sleep at night is having to talk about their org to their non-engineering boss: the CEO.
Every other department in a company relies on simple, straightforward, and easily understood data on their performance and contribution to the company. Marketing has leads acquired. Sales has deals closed. HR has open roles versus roles filled.
I’ve been on both sides of the boardroom presentation–and I’d like to make sure no CTO or VP ever struggles to give updates that showcase engineering progress in an understandable way and build confidence in engineering’s ability to align with business needs.
Why Cracking The Communication Barrier With Your CEO Is Essential
It can’t be said enough: If you have a CEO who understands your work and your team’s work, not only will your sanity be saved, but the boardroom will:
-
See the engineering org as a value add, not a cost center,
-
Shift the conversation from “Engineering is not delivering fast enough!” to “What are we doing to streamline delivery?”
-
Engage in a data-based discussion about the ROI of giving you additional resources (budget, talent).
Engineering Data That Resonates With CEOs
CEOs want to know two things about their departments: That they are running efficiently and that the things they’re working on are making an impact.
The most critical top-level metrics for engineering health
These metrics reveal inefficiencies, bottlenecks, and blockers in the development process. They’re also the best indicators of predictable delivery against promises made to other departments.
Cycle Time: The duration it takes from the start of a task to its completion. Shorter cycle times indicate a healthy and efficient workflow.
Lead Time: The period from the customer’s request to the product’s delivery. It includes the cycle time and any waiting period before development begins.
Merge Frequency: The frequency with which code changes are merged into the main codebase. Frequent merges can indicate a robust continuous integration process and maturity in agile development.
The most critical metrics on engineering alignment
Engineering teams must ensure the most significant allocation of resources is dedicated to projects that align to business priorities and drive better outcomes.
Business Impact: Categorizing projects or tasks based on their potential to affect business outcomes, ranging from low to high.
Full-time Equivalent (FTE): This is a standardized measure for the amount of work put into a project or initiative. One FTE is the work expected from one full-time employee.
Estimated Cost: Attaching a monetary value to work estimates, thereby providing a clearer picture of the resources being invested in specific projects.
The 4 Slides CEOs Love
As someone who has been on both sides of these slides, they are the most easily digestible yet impactful way for CTOs and CEOs to get on the same page.
Slide 1 – Overall Health Update
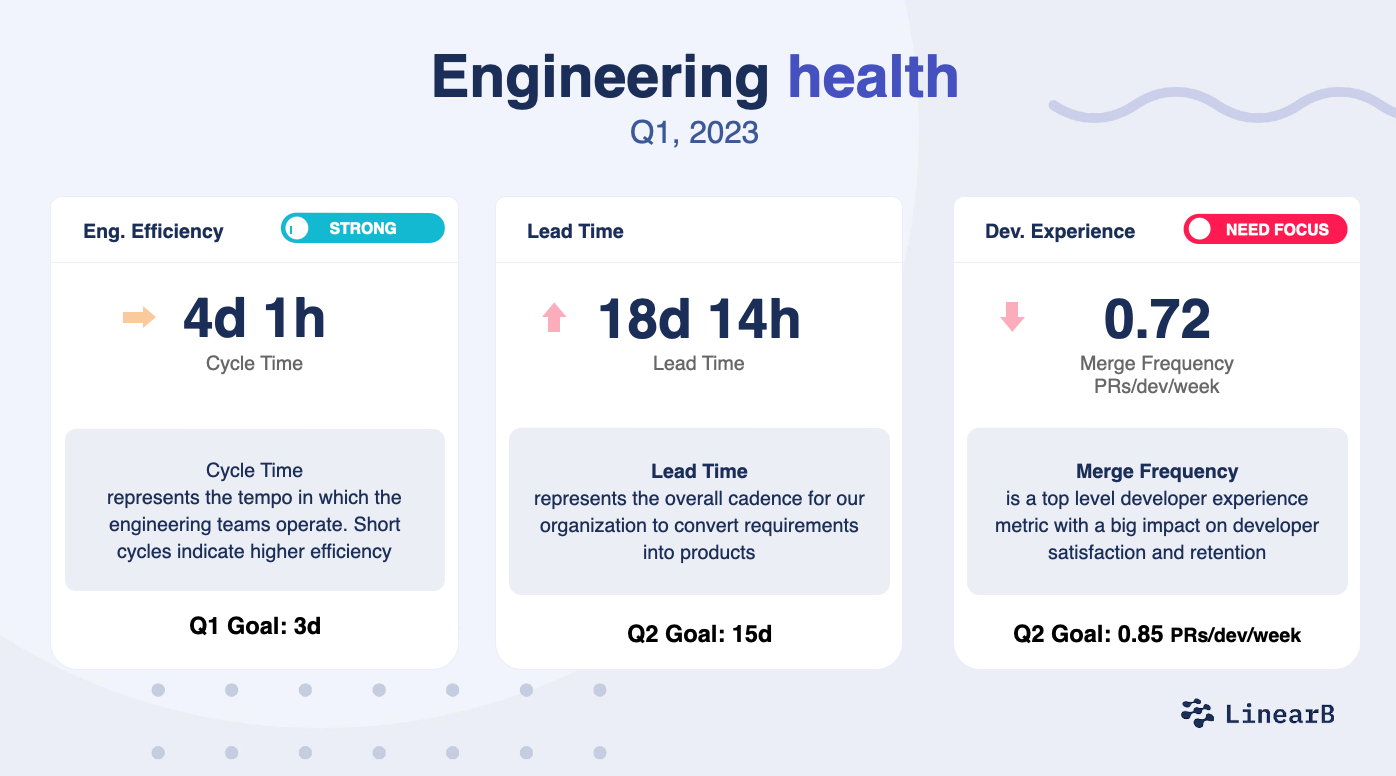
In this slide, a CEO can understand how your team’s production pipeline works, as well as overall efficiency, execution, and developer experience – which are all crucial for predictable project delivery.
Showing where you stand compared to industry benchmarks helps your CEO understand the “so what?” And by communicating the trend (are we up or down from the last time we met?) and the goal (this is where I’m taking my dept), you help your CEO trust that you know what’s going on and you have a plan.
Slide 2 – Engineering Investment Strategy
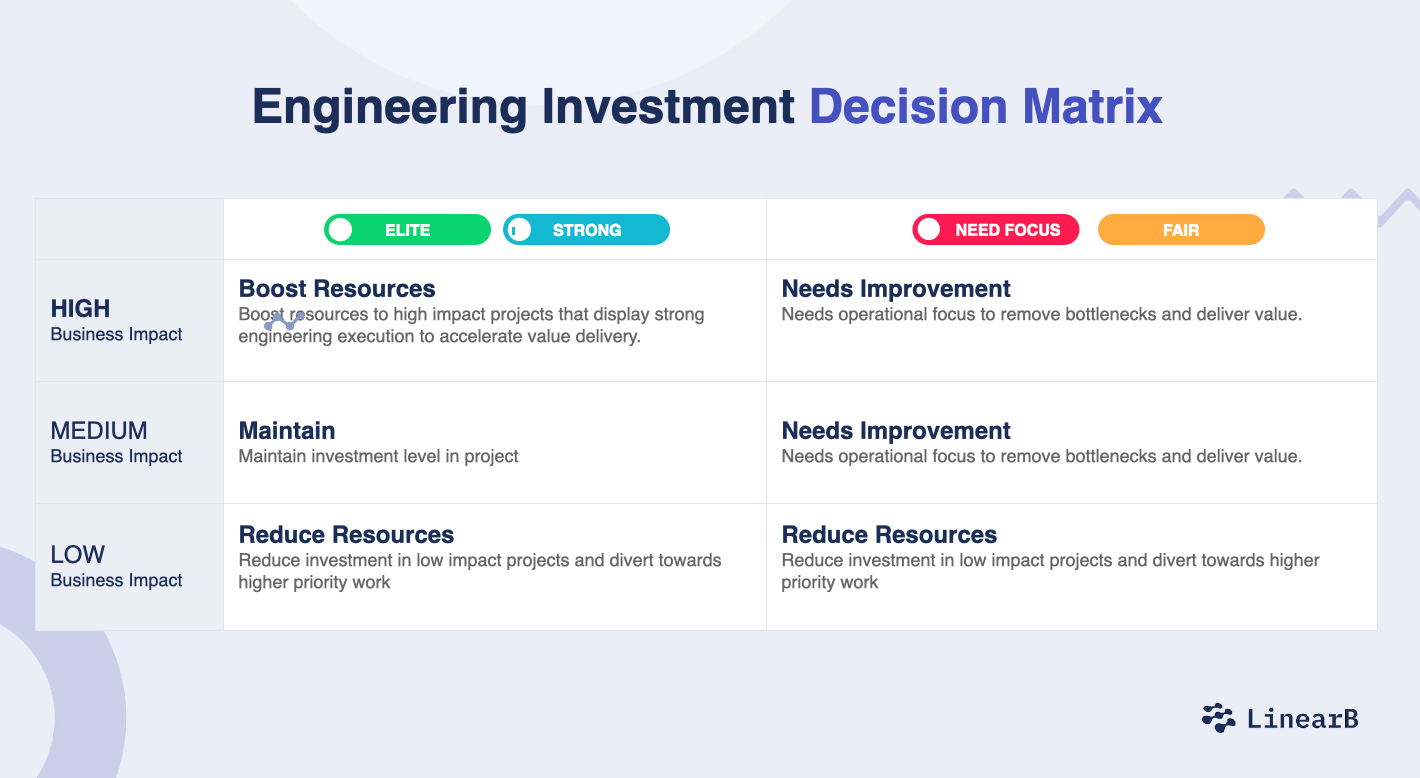
Your CEO needs to understand the state of your projects – their impact on the company as well as how well they are executing.
The above decision matrix – divided into a project’s impact and engineering execution health – allows you to review how your team spends its time, where you need to increase or decrease resources, and where you should invest in improving execution before throwing in more resources.
Slide 3 – Engineering Investment Updates
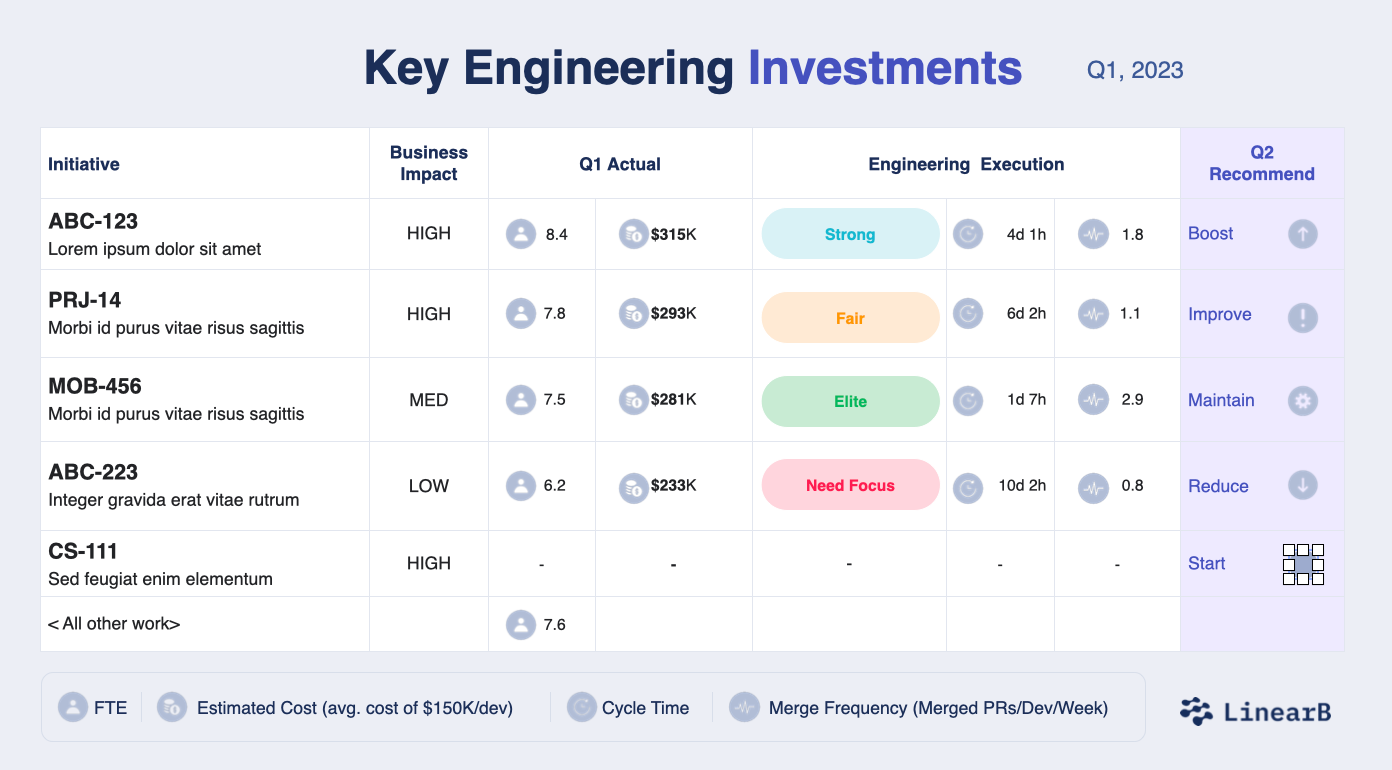
With the decision matrix as our guide, this slide highlights the key investments, showing the level of investment in each project (headcount, as well as dollars), the business impact, and the engineering execution scores. It gives an incredible, digestible overview of what’s going on, and a structured way to present your recommendations on next steps.
Slide 4 – Engineering Health Update

To complement the first slide on workflow health, this final piece provides a 360-degree review of engineering metrics related to the integrity of engineering operations – namely, its stability and amount of bugs. If MTTR, CFR, and the delta between “bugs created” and “bugs resolved” worsen, you’ll need to figure out how to course-correct. This often entails quality days, ensuring PRs stay short, and making sure PRs get appropriate reviews.
How To Build On These Slides
If these slides don’t just appease your CEO but excite them, you can also offer slides with data and trend analysis on:
-
Investment breakdown by issue type (story vs. task, etc.)
-
Lead time changes over time
-
Production bug tracking
-
Developer experience trends
To start using these slides, as well as the optional ones just mentioned, you can download the free presentation deck right here.If you want to fill these slides out with your data, you can get a free account of LinearB today!
This article was written by Yishai Beeri, CTO @ LinearB

Get The Deck!